Recently I switched to collectd for keeping track on long term variantions within my little server landscape. Even that munin was less pain to install and initiate the burden for the simple servers I use are much too high. So something smaller and easier to maintain was needed and I found collectd. Easy tool but without any graphing option. So I came across drraw for the visualization. Also a very simple tool with no overhead but also with a very limited documentation.
Installation of collectd and drraw in Debian Linux is quit forward, so just use apt-get install and your done.
Even the configuration of the plugins for collectd is easy. So finally I needed to switch to a centralized logging configuration using the following two options:
collectd-server:
<Plugin network>
Listen “Server ip”
</Plugin>
collectd-client:
<Plugin network>
Server “server ip”
</Plugin>
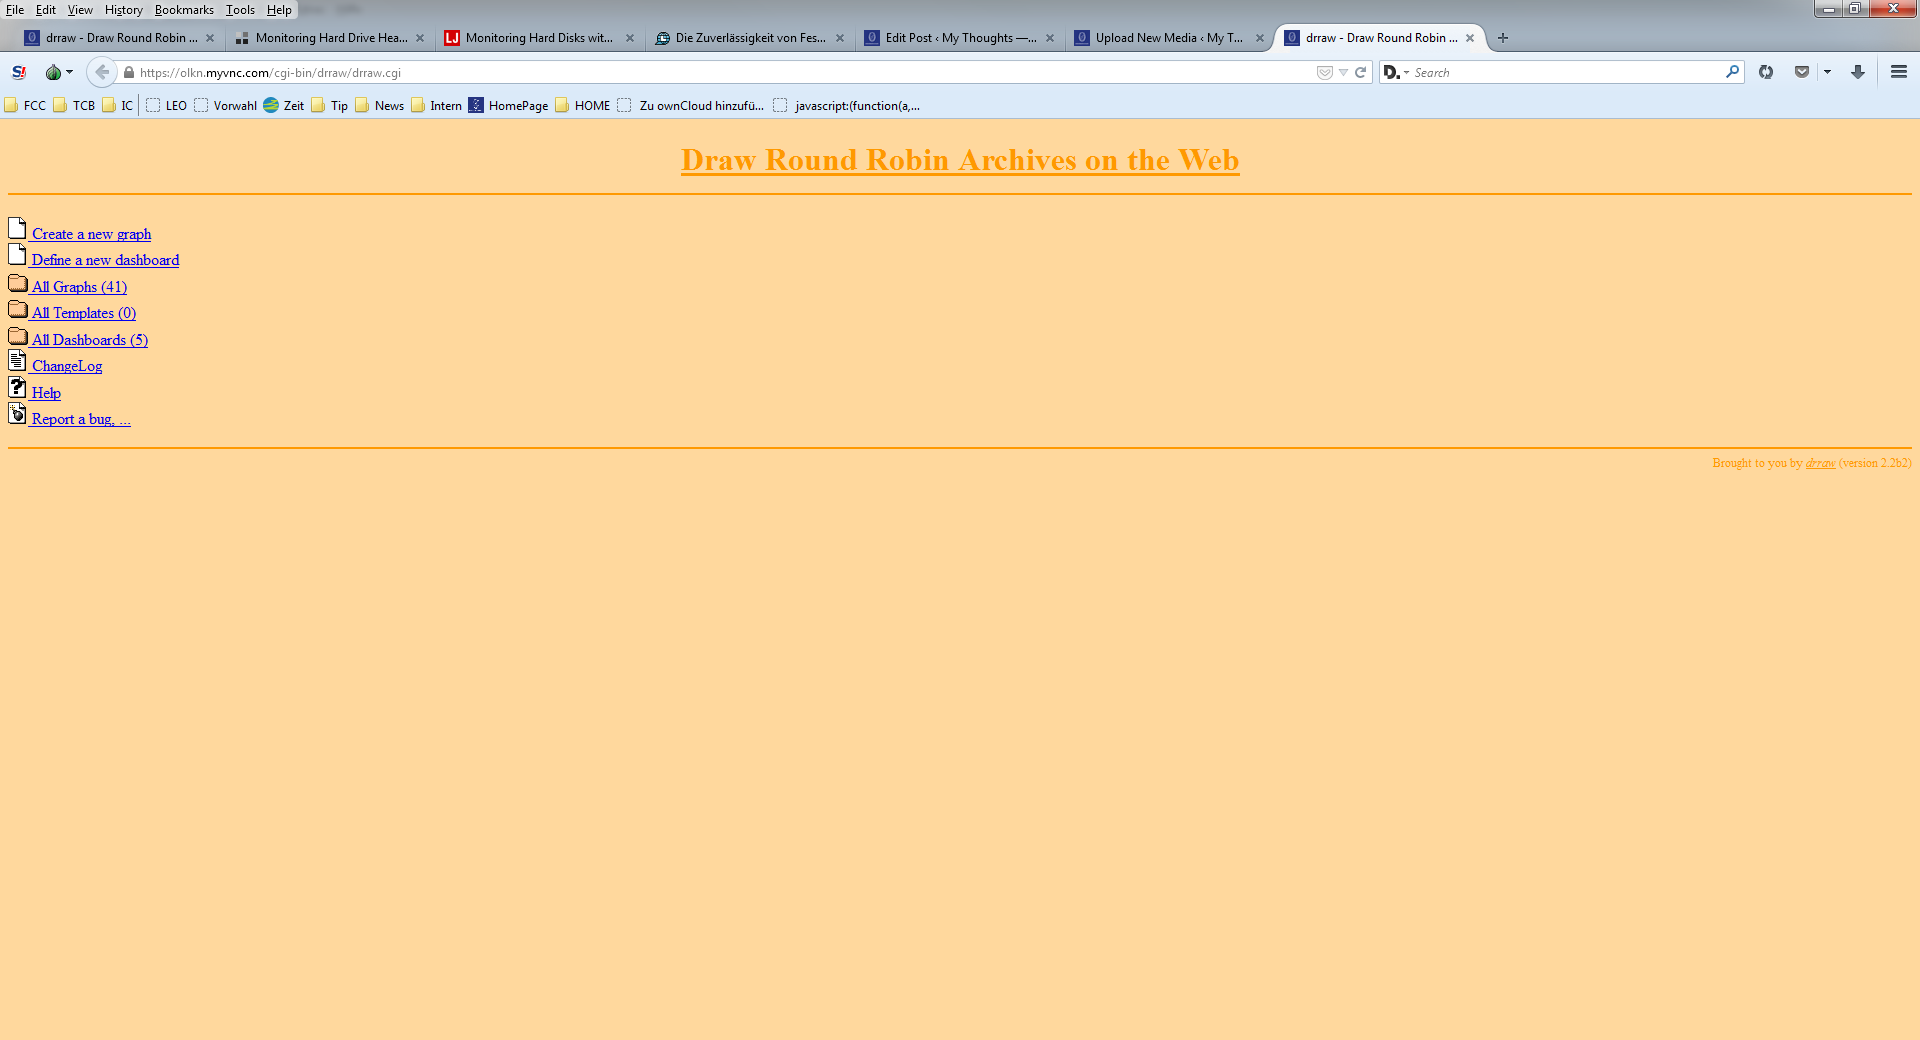
For drraw to generate nice looking graphs it took me more effort.So first of all grant access to drraw.cgi in your webserver config and then start using it: http://localhost/cgi-bin/drraw/drraw.cgi
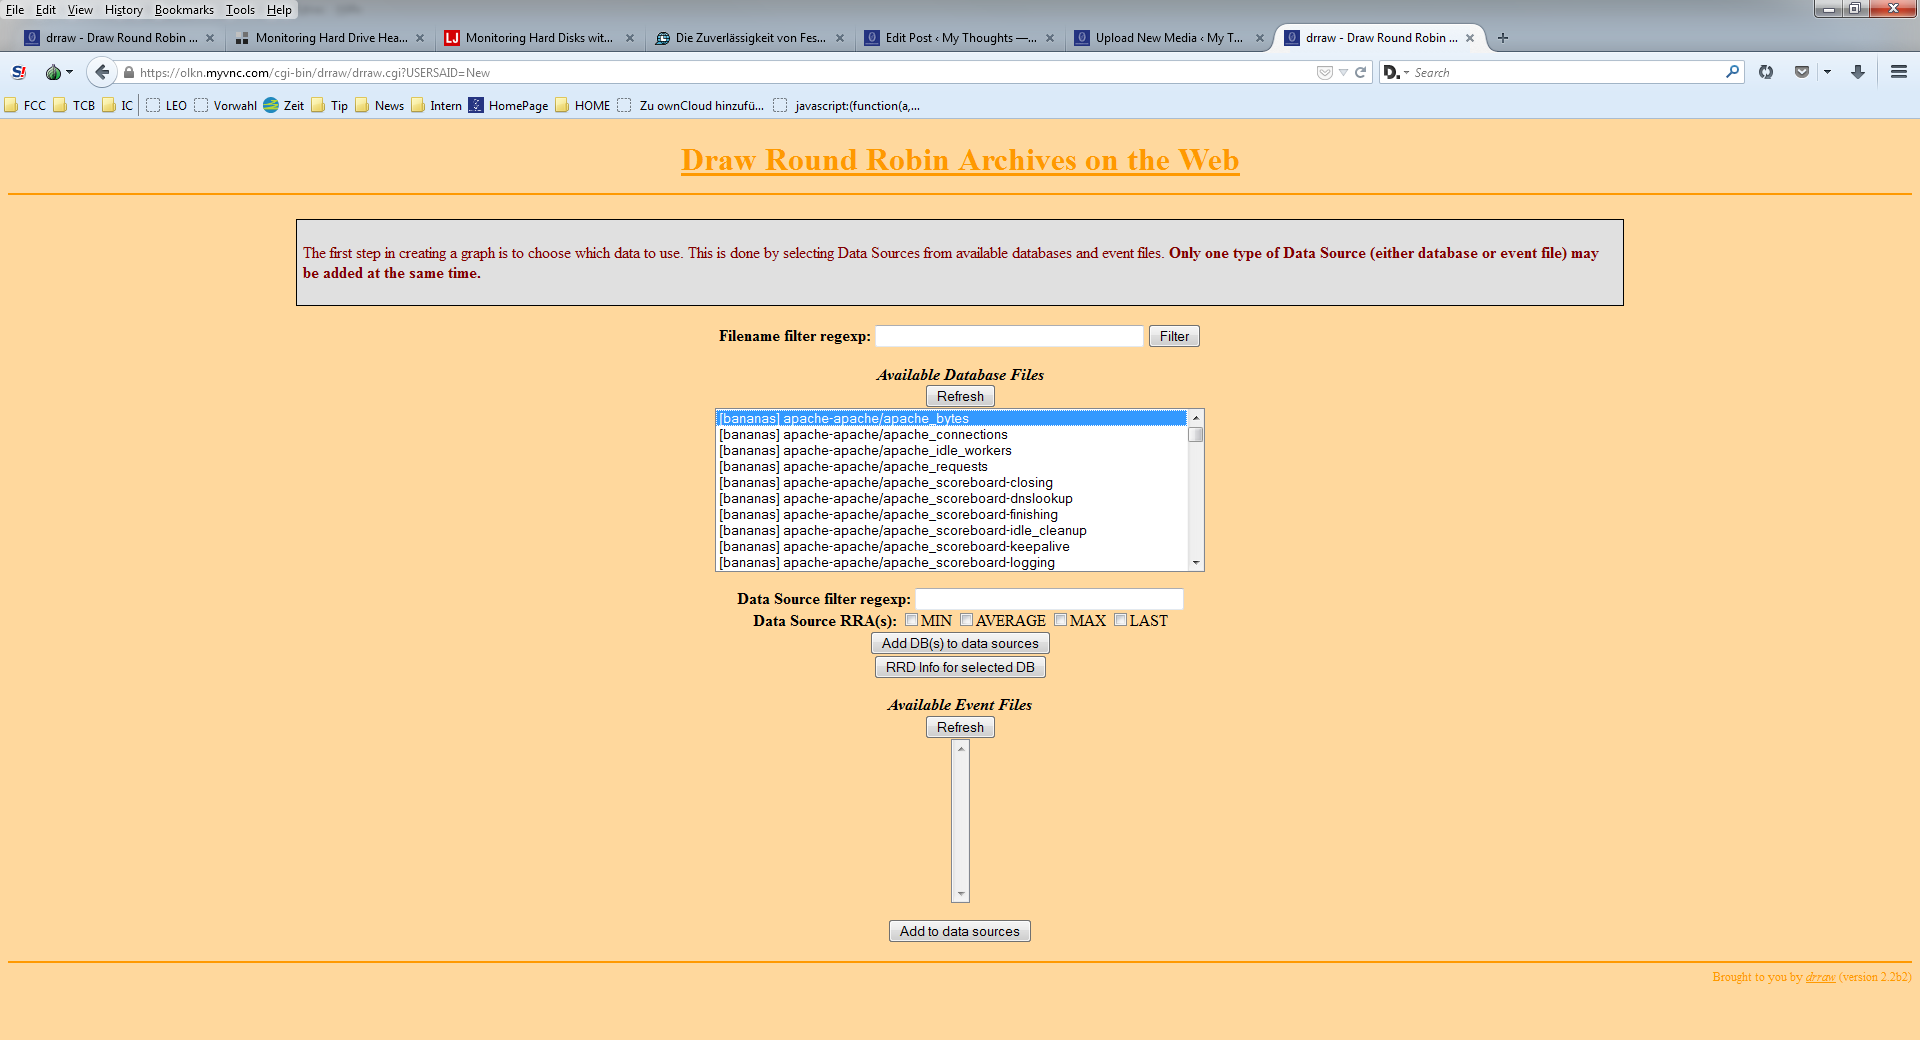
Of course we need to create a graph now which includes as a first step to choose the rrd source
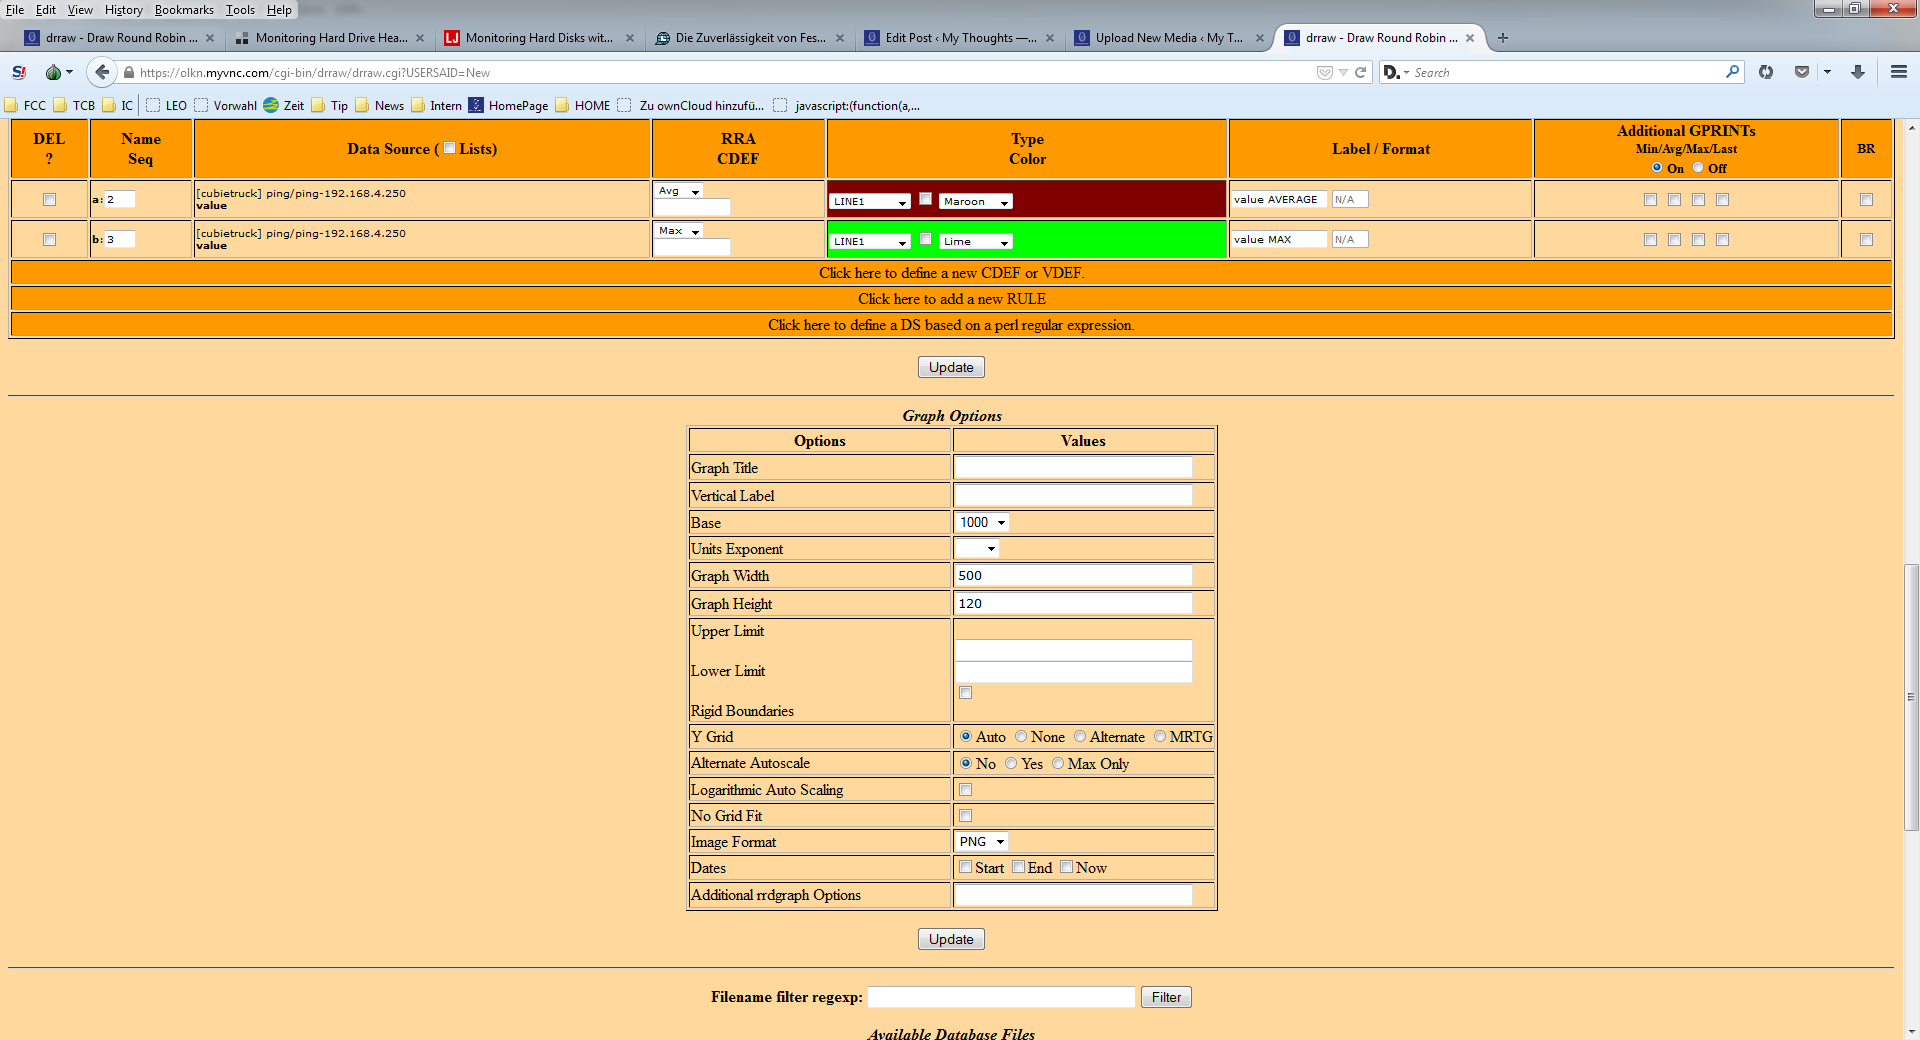
The next step is to define the graph with lines, colors, caption, etc.
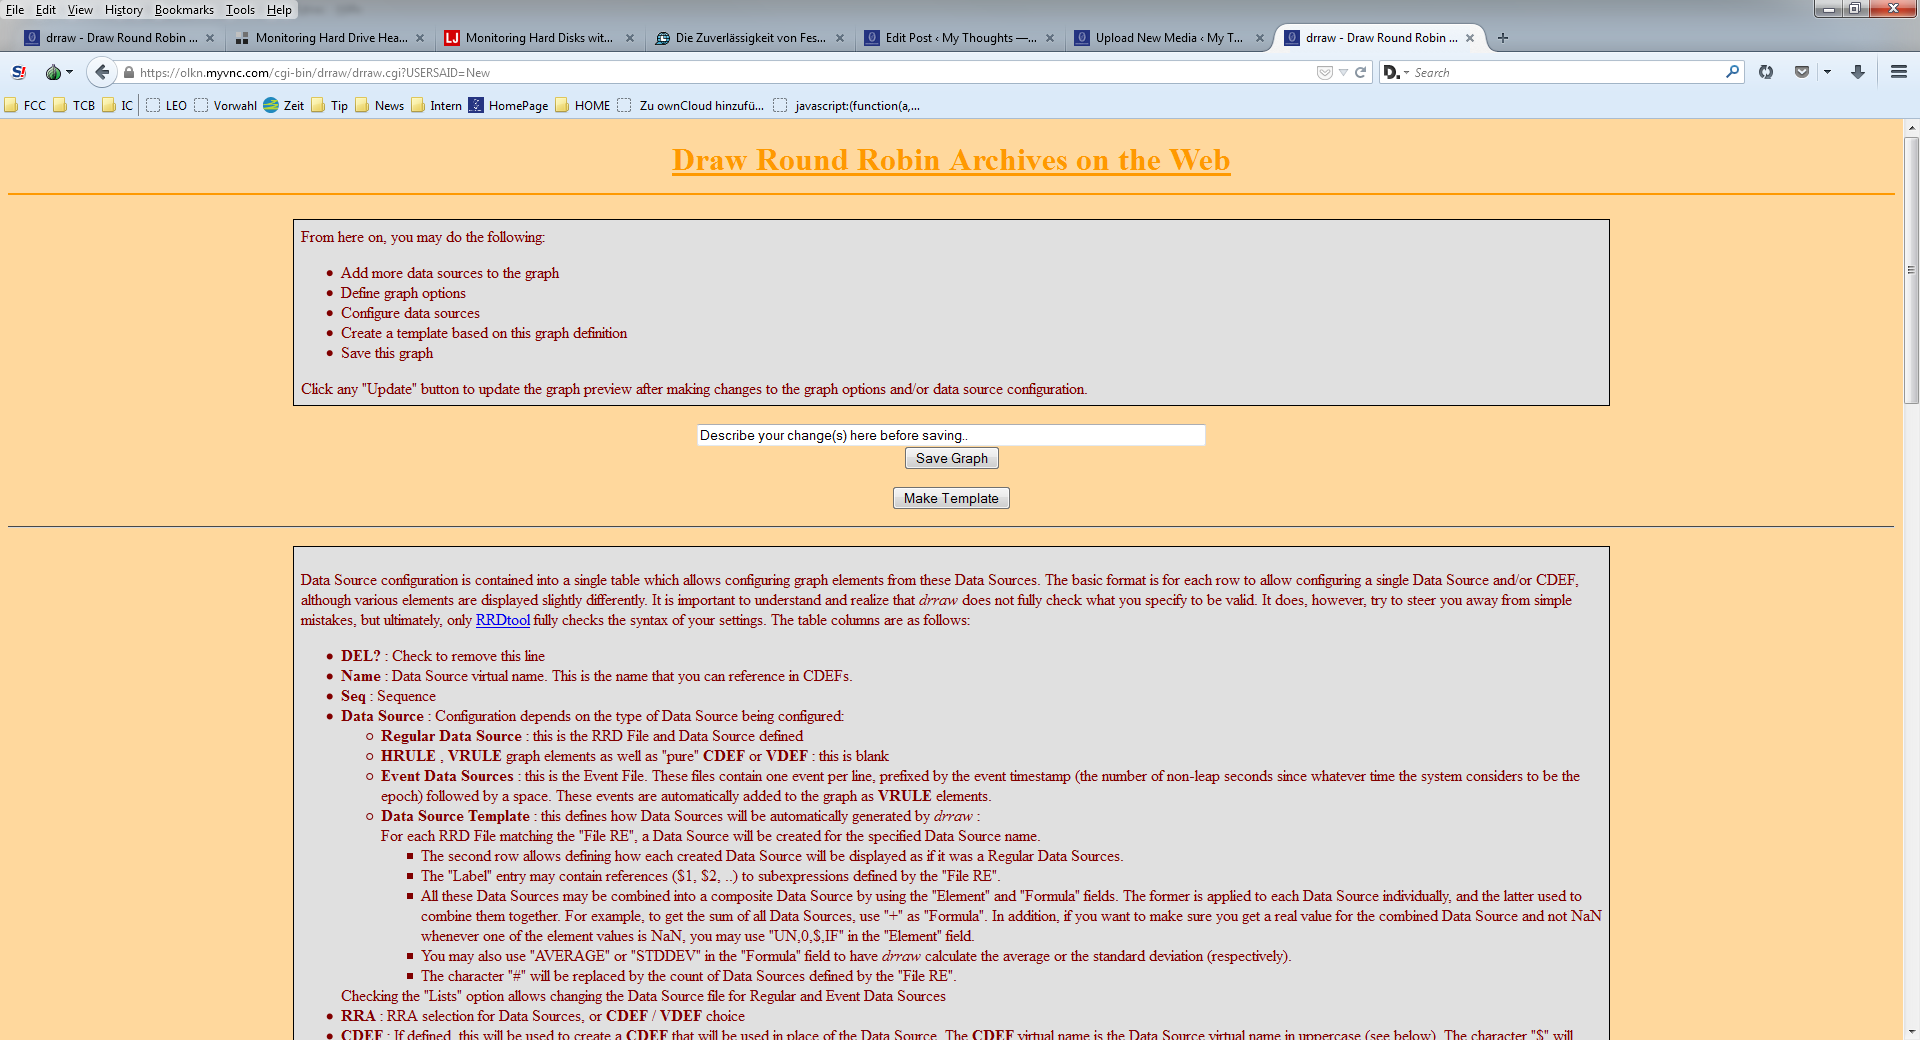
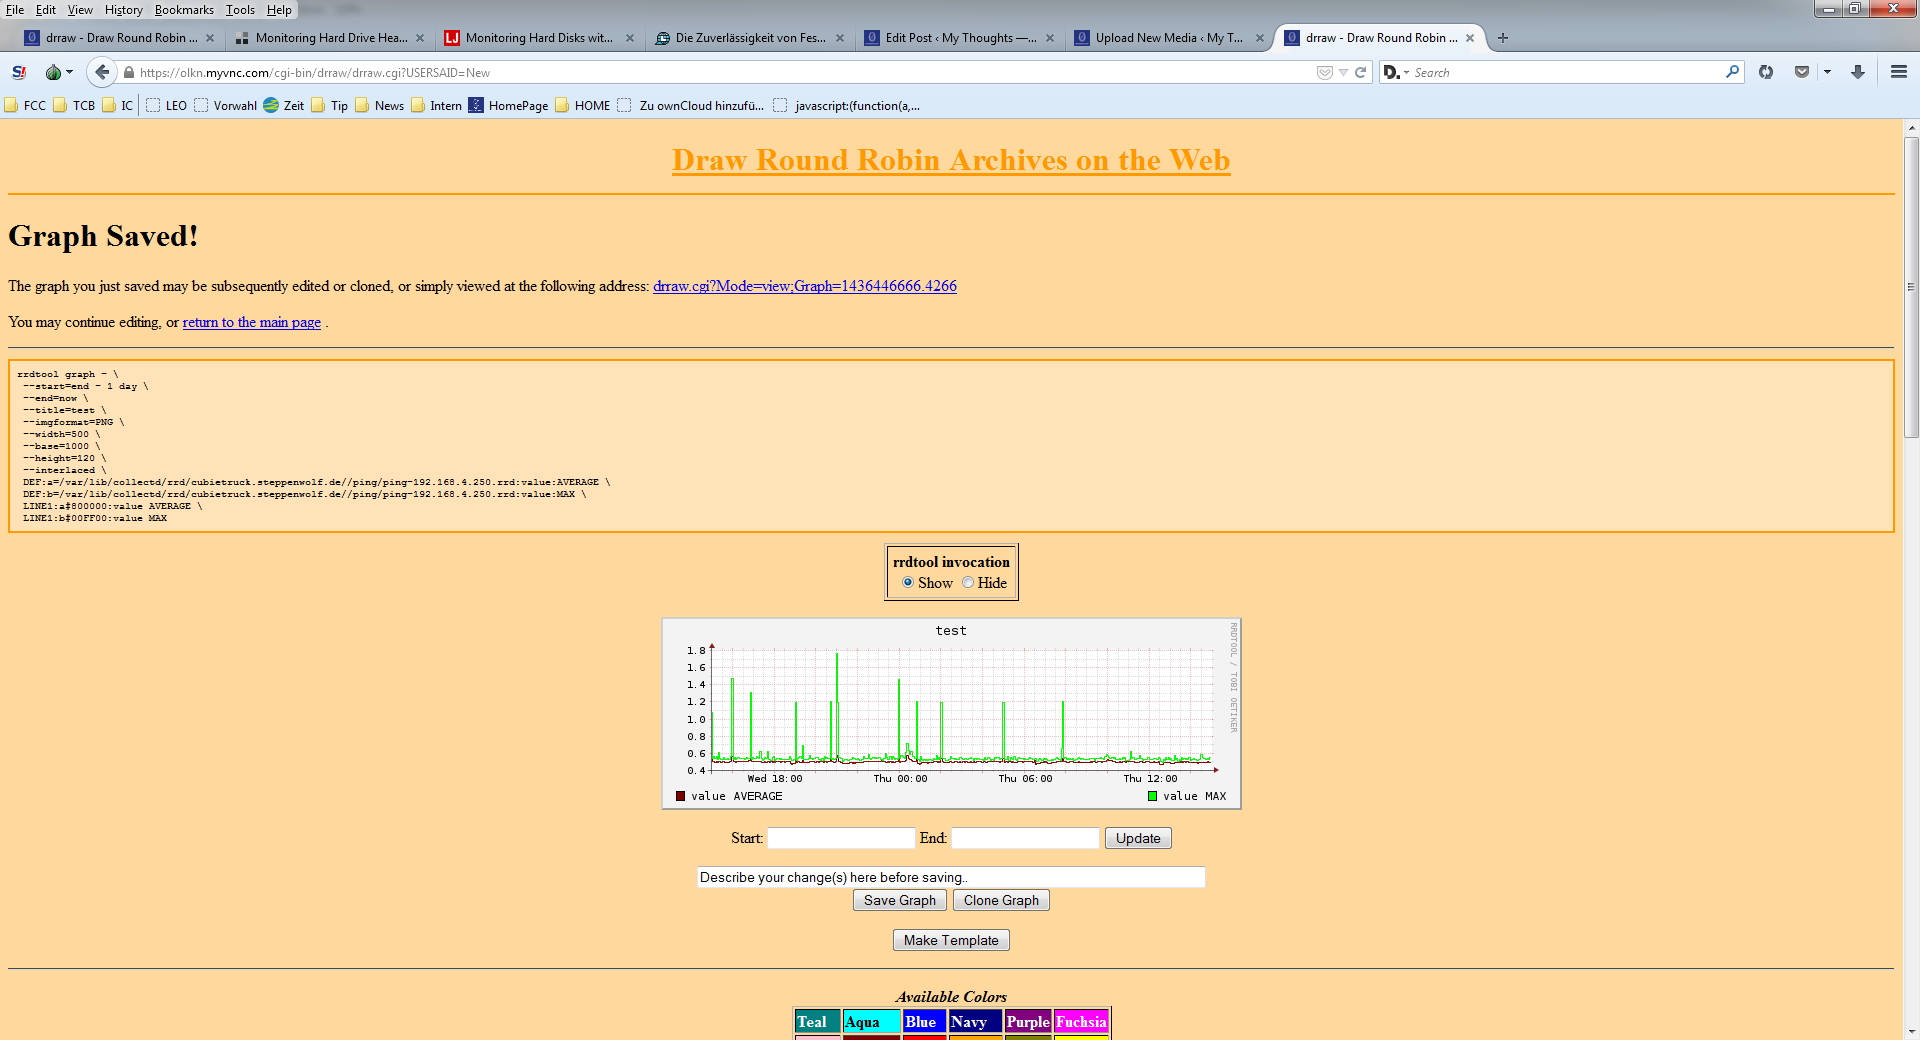
And finally the graph must be saved in order to be kept for later view
And now some words about rpn (reverse polish notation) which is the system used by rrdtool to do the arithmetics. I just needed some additions but even this costs me some time to get right. Here is an excerpt:
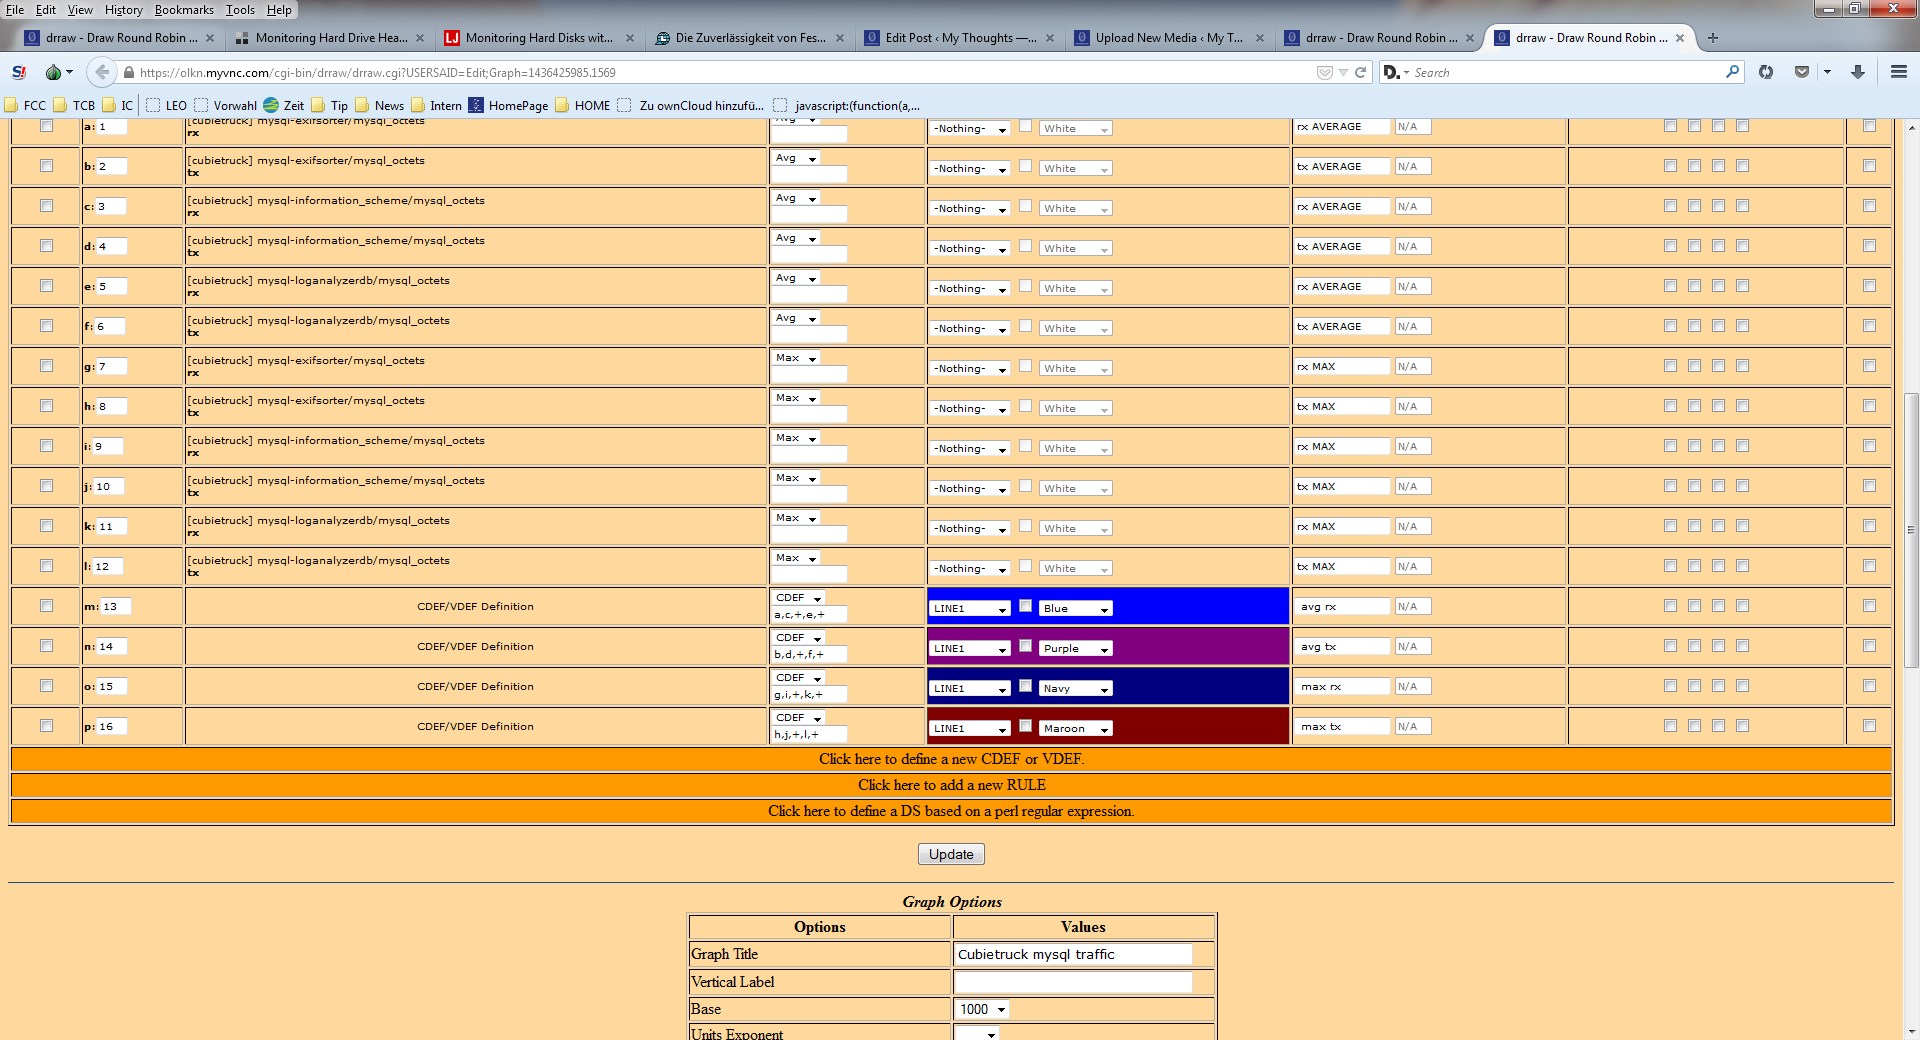
to add four lines named a,b,c,d to one resulting line an CDEF must be created with the following data source: a,b,+,c,+,d,+